
Free ATI TEAS 7 Mathematics guide
November 2026 - Visualizing Data Study Guide for nursing students in
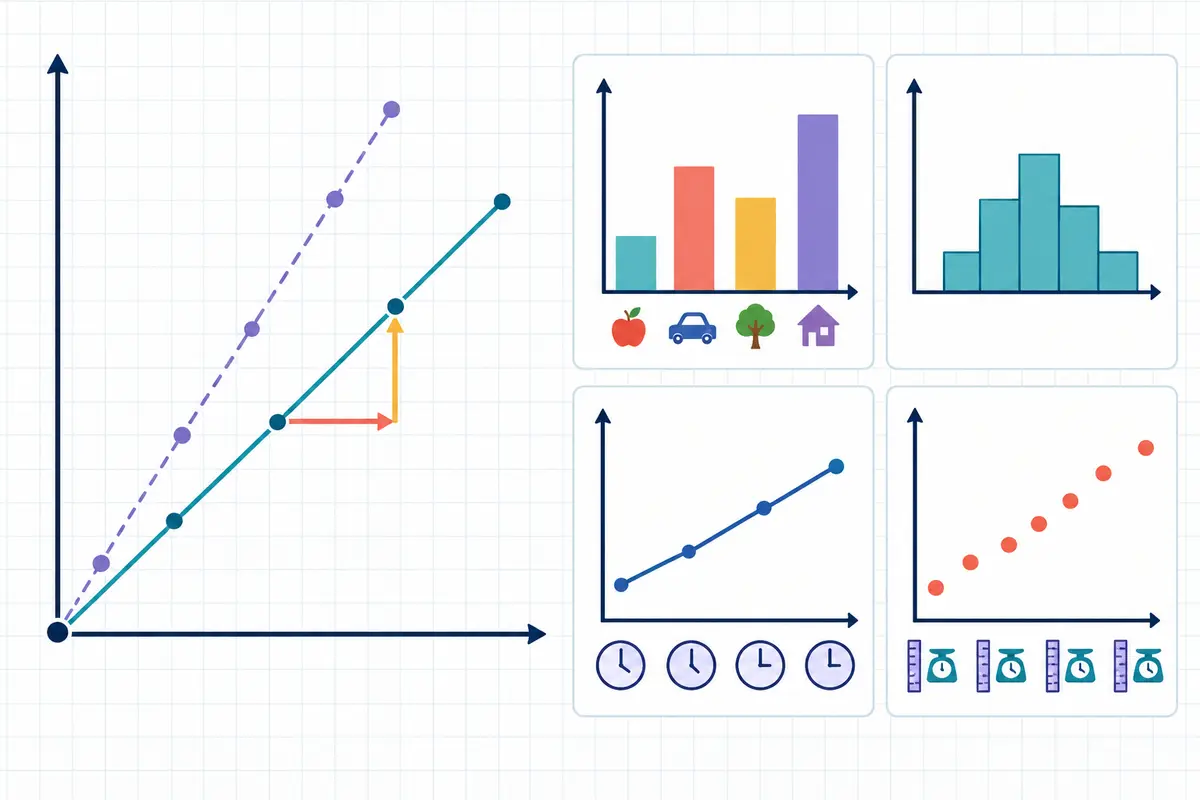
Bar charts compare categories, line graphs show change over time, pie charts show parts of a whole, and scatter plots show the relationship between two variables. The exam asks both which display suits a data set and what a given display does and does not show.
Updated November 2026
Practice As You Read
Try 4 short questions throughout this guide. Check each answer to learn from the explanation.
Matching the display to the question
| Display | Shows | Use when |
|---|---|---|
| Bar chart | Comparison between separate categories | The categories are distinct — wards, drugs, months as labels |
| Line graph | Change in one measure over time | The x-axis is continuous and the trend matters |
| Histogram | How often values fall in each range | The data is numeric and you want its distribution |
| Pie chart | Each part as a share of one whole | The parts sum to 100% of a single group |
| Scatter plot | The relationship between two variables | Each point has two measurements |
| Box plot | Median, quartiles and spread | You care about the middle and the range, not individual values |
| Stem-and-leaf | Distribution while keeping every value | The data set is small |
Bar chart or histogram?
They look similar and they answer different questions. A bar chart compares things that have no numerical order — five wards, four drugs — so the bars could be rearranged without loss and are drawn with gaps between them.
A histogram groups a numeric variable into intervals: patients aged 20–29, 30–39, and so on. The bars are in a fixed order, touch each other, and the shape of the whole thing is the point. Reordering a histogram destroys its meaning.
Question 1 of 4
A researcher wants to display the relationship between patients' body weight and their resting heart rate. Which display is most appropriate?
View the Answer and Explanation
Correct answer: B. A scatter plot
Each patient contributes two measurements, and a scatter plot is the display built for paired data. A pie chart shows shares of a whole, a histogram shows the distribution of one variable, and a bar chart compares categories rather than relating two numeric measures.
How a display misleads
Questions frequently ask what is wrong with a chart rather than what it says.
- A y-axis that does not start at zero — small differences look dramatic.
- Uneven intervals on a time axis — a steady trend looks like a sudden change.
- Percentages without a total — a pie chart of 4 patients and one of 4,000 look identical.
- Two pie charts compared directly — shares can only be compared if the wholes are the same size.
- A scatter plot read as cause — a pattern shows association, not that one variable produces the other.
A pie chart cannot show change over time and cannot compare two groups. If a question offers a pie chart for either job, it is the wrong display no matter how the data is arranged.
Question 2 of 4
Which display would best show how many patients on a ward fall into each ten-year age band?
View the Answer and Explanation
Correct answer: B. A histogram
Age bands are ordered numeric intervals and the question is about frequency in each, which is precisely a histogram. A line graph implies continuous change over time, a pie chart would show shares while hiding the shape of the distribution, and a scatter plot needs two measurements per case.
Choosing a display
Worked example
A clinic has recorded its monthly no-show rate for the last three years and wants to show whether it is improving. Which display, and why?
- What kind of variable is on the x-axis? Time, continuous, in order.
- What is the question? Whether the value is trending, not how the total divides up.
- Rule out a pie chart: it shows shares of one whole and cannot represent change.
- Rule out a bar chart: it would work, but 36 bars obscure the trend a line makes obvious.
A line graph, with months on the x-axis and the no-show rate on the y-axis. Time on a continuous axis plus a question about trend is the line graph's exact purpose.
Terms to know
- Bar chart
- A display comparing separate categories with bars of proportional length.
- Histogram
- A display of how often numeric values fall into each interval.
- Line graph
- A display of change in one measure across a continuous axis, usually time.
- Pie chart
- A circle divided into shares of one whole.
- Scatter plot
- A display of paired measurements, one point per case.
- Box plot
- A display of median, quartiles and range.
- Frequency
- How many times a value or range occurs.
- Distribution
- The shape of a data set — where values cluster and how far they spread.
What the TEAS asks most
The same core ideas appear in different wording. If you can answer these without stopping to think, you have what this section requires.
Which display best represents this data?
Match the variable type and the question: categories to bars, time to a line, shares to a pie, pairs to a scatter.
What does this chart show?
Read the title, axes and units first, and answer only what the display can actually support.
Why is this chart misleading?
Usually a truncated axis, uneven intervals, or percentages with no total behind them.
What is the difference between a bar chart and a histogram?
Bars compare unordered categories; histograms show the distribution of a numeric variable in fixed intervals.
Question 3 of 4
A bar chart of infection rates on four wards has a y-axis running from 12 to 16 per cent. Why might it mislead?
View the Answer and Explanation
Correct answer: B. The truncated axis makes small differences between wards look dramatic.
Starting the axis at 12 rather than 0 means a ward at 15.5% appears to tower over one at 12.5%, when the real gap is three percentage points. Bar charts handle percentages and small category counts perfectly well; the axis is the problem.
Key points
- Bars compare categories, lines show trends, pies show shares, scatters show relationships.
- A histogram's bars are ordered numeric intervals and touch; a bar chart's do not.
- A pie chart cannot show change or compare two groups.
- A y-axis that does not start at zero exaggerates differences.
- A scatter plot shows association, never cause.
Question 4 of 4
Two pie charts show the distribution of blood types among patients at two hospitals. Why can the slices not be compared directly?
View the Answer and Explanation
Correct answer: B. Each pie shows shares of its own total, and the two hospitals may have very different patient numbers.
A slice is a proportion of its own whole, so 30% of 200 patients and 30% of 2,000 look identical while representing very different counts. Blood types do sum to the whole group, and the difficulty is the missing totals rather than anything about the chart type's treatment of small slices.
Knowledge Check Results
Answer the 4 questions in this guide to see your score, review each answer, and choose your next step.
Your Answers, Question by Question
Select a question to revisit the passage and explanation.
See Your Full TEAS Readiness Picture
Take the free diagnostic to discover your strengths across the exam and get a clearer plan for what to study next.
Keep reading
More TEAS Resources
Guides and tools across the TEAS course.
TEAS 7 Exam Prep
Format, sections, timing
TEAS 7 FAQ
Scoring, retakes, test day
Is the TEAS Hard?
An honest answer
How Long Is the TEAS 7?
209 minutes, section by section
What Is a Passing TEAS Score?
Your programme sets the bar
TEAS Reading
18 topics · 39 scored questions
TEAS Math
18 topics · 34 scored questions
TEAS Science
22 topics · 44 scored questions
TEAS English
21 topics · 33 scored questions
Free TEAS Practice Test
Sit a set before you buy
TEAS Plans & Pricing
Choose your access
Start TEAS Prep
Create your account
TEAS Study Guide
All four sections, free
8-Week Study Plan
Week-by-week schedule
TEAS Cheat Sheet
Formulas and high-yield facts
TEAS vs HESI A2
Which exam to take